


Significance
Pertussis has been on the rise in the United States, and, in 2012, the United States had the highest number of reported pertussis (whooping cough) cases since 1955. This study provides evidence of spatial clustering of nonmedical vaccine exemptions in kindergarteners and spatial clustering of pertussis cases in children age groups 5 years and younger and 10 to 14 years at the community level. The results suggest that states should reconsider allowing nonmedical vaccine exemptions. The data also suggest a need for the creation of a longer-acting pertussis vaccine or improved regimen and a revised vaccination schedule for the current acellular pertussis vaccine.
Abstract
Because of increased numbers of recorded pertussis cases in the United States, this study sought to understand the role of nonmedical vaccine exemptions and waning immunity may have had on the resurgence of pertussis in the United States at the community level. We used geospatial scan statistics, SaTScan, version 9.4, to analyze nonmedical vaccine exemptions of children entering kindergarten in 2011 and 2012 and reported pertussis cases in 2012 for children in age groups 5 years and younger and 10 to 14 years. Eight statistically significant clusters of nonmedical vaccine exemptions in kindergarteners and 11 statistically significant clusters of pertussis cases in children and adolescents were identified and geospatially linked. Forty-five percent of the counties in the study had high rates of nonmedical vaccine exemptions. The proportion of kindergarteners with nonmedical vaccine exemptions was 2.8 times larger in the identified exemption clusters. In addition, 31 counties had geographic clusters of high rates of pertussis in children ages 10 to 14 years old, consistent with waning immunity. Our findings are consistent with the view that geographic clusters of nonmedical vaccine exemptions and waning immunity may have been factors contributing to community-level pertussis outbreaks.
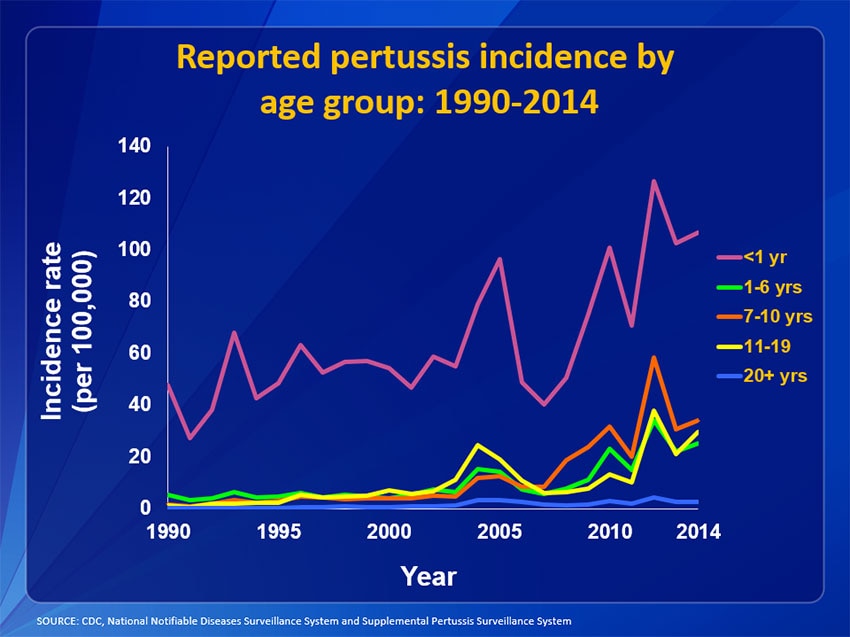
Vaccines represent one of the greatest achievements in medicine and public health. Vaccine programs in the United States have significantly decreased the number of cases of vaccine preventable diseases over the past century (1⇓⇓–4). The Centers for Disease Control and Prevention (CDC) has estimated that childhood vaccines have prevented 322 million illnesses, 21 million hospitalizations, and 732,000 deaths among children born in the United States between 1994 and 2013 (5) and effectively controlled many previously fatal childhood diseases (5). However, starting in the early 2000s, the number of reported pertussis cases in the United States, caused by Bordatella pertussis, has increased significantly (6, 7). In 2012, there were 48,277 cases of pertussis reported in the United States (8). This is the highest number of reported pertussis cases in the United States since 1955 (6).
Several studies have suggested reasons for the resurgence of pertussis in the United States, including waning immunity from the acellular pertussis vaccine that replaced whole cell vaccine (9⇓⇓⇓⇓⇓⇓⇓⇓–18); medical advancements that have allowed more effective diagnosis and reporting of pertussis cases (19, 20); asymptomatic transmission of B. pertussis from individuals vaccinated with the acellular pertussis vaccine (21, 22); evolving variant strains of B. pertussis circulating that are less protected by the vaccine (23⇓–25); and a decrease in vaccine coverage that has compromised herd/community immunity (1, 26⇓⇓⇓⇓⇓⇓⇓⇓–35). It is clear that the rise in reported pertussis cases in the United States is a multifaceted problem not fully captured in national or state-level data. One approach to understanding the rise in reported pertussis cases in the United States is the identification of statistically significant geographic clusters of events, such as pertussis outbreaks and clusters of nonmedical vaccine exemptions (27, 28, 36). The aim of this investigation was to identify statistically significant geographic clusters of high rates of pertussis cases and geographic clusters of high rates of nonmedical vaccine exemptions at the county level to gain a better understanding of the roles that waning immunity and nonmedical vaccine exemptions may have had on the resurgence of pertussis in the United States in 2012.
Results
In 2012, the overall national incidence rate for pertussis in the United States was 15.4 per 100,000 people (8). There were 19 states that had an overall incidence rate of pertussis higher than 15.4 per 100,000 people (8). Of the 19 states, only five had the detailed county-level data needed for this investigation; Arizona (17.2 per 100,000 people), New Jersey (15.7 per 100,000 people), Oregon (23.2 per 100,000 people), Utah (55.7 per 100,000 people), and Washington (71.3 per 100,000 people) (8). The county level data were collected from each state’s Department of Public Health. The state of Utah reported both the immunization data and pertussis cases at the health district level. In Utah, a health district can be a single county such as the Davis County health district or a group of counties such as the Bear River health district, which serves three counties.
To conduct the geospatial analysis, we used the spatial scan statistic, analyzing thousands of collections of contiguous counties as potential clusters (37). This method identifies localized, statistically significant (P < 0.05) geographic clusters of events adjusting for multiple testing (27, 28, 36⇓–38). We evaluated potential clusters between a 0- and 200-km radius by using the free software program SaTScan, version 9.4 (38).
To determine statistically significant geographic clusters of nonmedical vaccine exemptions, we used the reported counts of nonmedical vaccine exemptions at the county level for students entering kindergarten during the 2011–2012 and 2012–2013 academic years. To determine statistically significant geographic clusters of pertussis cases in 2012 for the two different age groups (5 years and younger and 10 to 14 years), we used the reported pertussis cases at the county level.
The distribution of statistically significant geographic clusters of nonmedical vaccine exemptions is presented in Table 1, and the distribution of statistically significant geographic clusters of pertussis cases by age group is presented in Table 2. The geospatial analysis of the geographic clusters of nonmedical vaccine exemptions and geographic clusters of pertussis cases for children ages 5 years and younger is presented in Fig. 1. Kindergarten vaccination status inside and outside of identified exemption and pertussis clusters for the age group 5 years and younger is presented in Table 3.
Spatial clusters of nonmedical vaccine exemptions for kindergarteners during the 2011–2012/2012–2103 academic years
Spatial clusters of pertussis cases for children ages 5 years and younger and children ages 10 to 14 years old, 2012

(A) Relative location of pertussis spatial clusters (2012) for children age 5 years and younger and exemption spatial clusters children enrolled in kindergarten (2011–2013) in Arizona, Oregon, Utah, and Washington. (B) Comparable analysis of data from New Jersey.
Kindergarten vaccination status inside and outside of identified exemption clusters and pertussis clusters
The data indicate that 45% of the counties in the study had high rates of nonmedical vaccine exemptions in kindergarteners. In the identified exemption clusters, 4.9% of the kindergarteners had nonmedical vaccine exemptions and 1.8% of kindergarteners with nonmedical vaccine exemptions lived outside of the exemption clusters. The proportion of kindergarteners with nonmedical vaccine exemptions was 2.8 times larger in the identified exemption clusters. In addition, 31 counties had geographic clusters of high rates of pertussis in children ages 10 to 14 years old, consistent with waning immunity (Table 2).
Discussion
The United States has achieved high rates of vaccination because of the school immunization requirements in all 50 states (1, 31). However, if one takes a closer look at the community level, there is substantial local variation in vaccination rates throughout the United States (27⇓–29, 36). It is the local variation in vaccination rates that is of concern because more than 90% of the community needs to be vaccinated against pertussis for herd/community immunity to be effective (39).
Adverse effects associated with the original whole cell pertussis vaccine led to the transition from the whole cell pertussis vaccine to the acellular subunit pertussis vaccine in the United States in the 1990s (9, 11, 40⇓–42). In 1997, the US Advisory Committee on Immunization Practices (ACIP) recommended the use of the diphtheria-tetanus-acellular pertussis (DTaP) vaccine instead of the whole-cell pertussis vaccine for all infants and young children born in the United States (40⇓–42). Based on the 1997 recommendations, the DTaP vaccine series was to be administered in five separate doses at the following ages: 2 months, 4 months, 6 months, between 15 and 18 months of age, and between 4 and 6 years old (40, 41). Therefore, it is reasonable to assume that any child born in 1998 or later in the United States that was immunized for pertussis would have received the acellular vaccine (11, 12).
Waning Immunity
After the switch to the DTaP vaccine, there was a change in the epidemiology of pertussis in the United States (7, 9⇓–11). Specifically, the number of reported pertussis cases in adolescents increased, which suggested there was waning immunity from the DTaP vaccine (7, 9⇓–11). Because of the increase in reported pertussis cases in adolescents, the ACIP made a recommendation in 2006 that a child between the ages of 11 and 12 years old should receive a booster shot for the pertussis vaccine in the form of the tetanus-diphtheria-acelluar pertussis (Tdap) vaccine (43). However, even after the recommended Tdap booster, there continued to be reports of increased rates of pertussis cases among adolescents (7, 9⇓–11).
In addition, immunologic studies have indicated that the acellular pertussis vaccine does not elicit the optimal profile of immune response required to sustain protective immunity against B. pertussis (22, 44⇓⇓⇓⇓⇓–50). Specifically, the immune response to the acellular pertussis vaccine has decaying antibody levels over time (45, 47, 48, 50) and that the acellular vaccine induced a T-helper (Th) Th2/Th17 response rather than a Th1/Th17 response that was seen with the whole cell pertussis vaccine (22, 44⇓–46, 49, 50).
According to the CDC, it was estimated that 84% of adolescents were up-to-date with their Tdap vaccine in 2012 (51). This investigation assumed that a comparable percentage, or at least majority, of children in the age group 10 to 14 had received their Tdap vaccine and, if immunity persisted over time, they should have been protected from developing pertussis. The results from the geospatial analysis identified 31 counties that had geographic clusters of high rates of pertussis in children ages 10 to 14 years old, indicating that immunity from the acellular pertussis vaccine was not sustained.
Nonmedical Vaccine Exemptions
Nonmedical vaccine exemptions have been on the rise in the United States (1, 26⇓⇓⇓⇓⇓⇓⇓⇓–35). The rates of nonmedical vaccine exemptions are not evenly distributed among communities, which indicates that obtaining nonmedical vaccine exemptions tends to be a socially and spatially clustered behavior (27, 28, 36). The clustering of vaccine refusal creates “hot spots” in communities where herd/community immunity against vaccine preventable disease is compromised. Several important studies have pointed to nonmedical vaccine exemptions being a factor that has likely contributed to the increasing rates of pertussis cases in the United States (26⇓⇓–29).
The present study is a multistate study that used geospatial analysis at the community level in counties to explore geographical clustering of nonmedical vaccines and geographic clustering of pertussis cases in the United States. We found evidence of spatial clustering of nonmedical vaccine exemptions in Arizona, Utah, Oregon, and Washington. Forty-five percent of the counties in this study were identified as having high rates of nonmedical vaccine exemptions. The proportion of kindergarteners with nonmedical vaccine exemptions was 2.8 times larger in exemption clusters.
Our findings are consistent with previous studies that examined geographic clusters of nonmedical vaccine exemptions and geographic clusters of pertussis cases (27, 28, 36). The findings are consistent with previous studies indicating that waning immunity is associated with the acellular pertussis vaccine (9⇓⇓⇓⇓⇓⇓⇓⇓–18). Although we recognize that correlation does not establish causation, the findings from this investigation are consistent with previous suggestions that geographic clusters of nonmedical vaccine exemptions and waning immunity may have been two of several factors that contributed to community-level pertussis outbreaks.
Our findings also indicated that there was geographic overlap between clusters of high rates of pertussis in children age 5 years and younger and clusters of high rates of pertussis in children ages 10 to 14 years old. Ninety percent of counties with high rates of pertussis cases among children ages 10 to 14 also had high rates of pertussis cases in children ages 5 years and younger, Table 2. These findings were expected because pertussis is highly infectious and spreads easily within households and communities. The results from a 2015 investigation indicated that siblings are the primary source of pertussis infection among infants (52). Thus, communities where there are high levels of nonmedical vaccine exemptions have some risk for community-level pertussis outbreaks in both young children and adolescents.
California, which suffered a major outbreak of measles in 2014, recently passed Senate Bill 227 to eliminate nonmedical vaccine exemptions and increase vaccination rates within the state to help reduce rates of vaccine preventable diseases (53). It will be important to analyze the effects of this legislation, which can be considered as a large-scale population experiment, on the incidence of pertussis and other vaccine preventable diseases.
Limitations
There are several limitations of this investigation. The first was accounting for immunization data from children in kindergarten who were homeschooled during the 2011–2012 and 2012–2013 academic years. In 2012, the US Department of Education reported that the number of children who were homeschooled for kindergarten was so small that there were too few cases to report reliable estimates (54). A second limitation of this investigation was that children who have medical exemptions from immunization laws were not included in the study. However, medical exemptions are rare and are not expected to be clustered. A third limitation was that children that are underimmunized and failed to complete the recommended immunization schedule were not identified and included in this study. When children are underimmunized they have greater susceptibility to becoming infected with vaccine preventable diseases.
It is important to note that the clustering of nonmedical vaccine exemptions found in this study may have been affected by variations in county-level implementation and variations in school reporting (28). Pertussis, like other infectious diseases, can be underdiagnosed and underreported and, as noted in previous studies, there is no reason to conclude that the underreporting of pertussis would be differential in terms of exemption clusters (28).
The increase in cases of pertussis and outbreaks of other vaccine preventable infectious diseases in the United States is clearly a multifaceted problem. We believe our study contributes to a better understanding of why reported pertussis cases and outbreaks in the United States have been on the rise. It is our hope that these results can help policymakers become more informed regarding decisions about nonmedical vaccine exemptions. The data from this study suggest the need for support for research to develop a more enduring acellular pertussis vaccine or regimen, for strengthening surveillance activities at the local level, and for creating an updated vaccination schedule for the current pertussis vaccine, all of which will contribute to better protecting children and communities from vaccine preventable diseases.
Methods
The spatial Bernoulli model (38) was used to identify statistically significant geographical clusters with a high proportion of children with nonmedical vaccine exemptions. The Bernoulli model was selected because there was a set number of children enrolled in kindergarten during the 2011–2012 and 2012–2013 academic years and those children either had a nonmedical vaccine exemption or were vaccinated. All of the data analyzed were derived from publicly available sources. The immunization status of students reported to the Departments of Public Health were self-reported by schools and provided a snapshot of immunization coverage at the start of each academic year. It is important to note that six counties did not have data available, and nonmedical vaccine exemption data for Washington state was only available for the 2012–2013 academic year.
The spatial Poisson model (38) was used to identify statistically significant geographical clusters of pertussis cases in each age groups. The age group 5 years and younger was selected because children age 5 years and younger had the highest incidence rate of pertussis in 2012 (8). The age group 10 to 14 years was selected because it was assumed that children born between 1998 and 2000 only received the acellular vaccine (11, 12). Analysis of the 10 to 14 years age group helps to understand the impact of waning immunity on the 2012 pertussis outbreak (9⇓⇓–12). Six counties did not have data available, and Oregon did not have reported pertussis cases for the age group 10 to 14 years at the county level, therefore the state was not included in this age group analysis. Lastly, immunization status for the 10- to 14-year-old age group at the county level was not available and could not be accounted for in this data analysis.
A second SaTScan analysis was completed to compare unadjusted pertussis datum to pertussis datum that was adjusted based on whether the county was located in an identified nonmedical vaccine exemption geographic cluster. The results of the second analysis produced similar results and did not provide additional data to further understand the relationship between nonmedical vaccine exemption clusters and pertussis clusters (Table 3).
Acknowledgments
We thank Prof. Gary King, Albert J. Weatherhead III University Professor at Harvard University, and Jason Ur of The Center for Geographic Analysis at Harvard University. M.K. was funded by National Institute of Allergy and Infectious Diseases Grant 5R01AI107721. B.R.B. is Joan L. and Julius H. Jacobson II Research Professor of Public Health.
Footnotes
- 1To whom correspondence should be addressed. Email: bbloom@hsph.harvard.edu.
-
Author contributions: C.A. designed research; C.A. performed research; M.K. contributed new reagents/analytic tools; C.A., M.K., and B.R.B. analyzed data; and C.A. and B.R.B. wrote the paper.
-
Reviewers: F.C.C., Johns Hopkins Bloomberg School of Public Health; and A.M., Princeton University.
-
The authors declare no conflict of interest.
Freely available online through the PNAS open access option.
References
FUENTE: http://www.pnas.org/content/114/27/7101.full?sid=5c5b9793-a1ed-4443-a8ce-483ba66bbb58